Now Reading: XRP Builds Pressure Below $3 As RSI Breakdown Signals Imminent Move
-
01
XRP Builds Pressure Below $3 As RSI Breakdown Signals Imminent Move


XRP prices recorded an overall 1.26% loss in the past week amidst a crypto market struggling to re-establish a bullish trajectory. After reaching a local price peak of $2.58 on May 15, XRP has witnessed an extensive correction forcing prices to around $2.06. Interestingly, prominent market expert with X username CasiTrade has shared a bullish prediction hinting at an upcoming price reversal.
Flush Then Fly? XRP Chart Patterns Point To Key Support Test
In an X post on June 20, CasiTrades postulates that XRP is currently at a technical inflection point with significant bearings on its next price movement. Based on the presented daily trading chart, it can be inferred that the prominent altcoin is on the edge of a price breakout or breakdown due to the formation of a descending triangle pattern.
However, CasiTrades states that there are larger implications in recent developments of the relative strength index (RSI). Notably, the analyst explains the XRP daily RSI trendline is now breaking down signaling a confluence of market conditions including declining volatility, muted price action, and, most importantly, an accumulation of pressure within the market which aligns closely with the tightening range seen in the descending triangle.
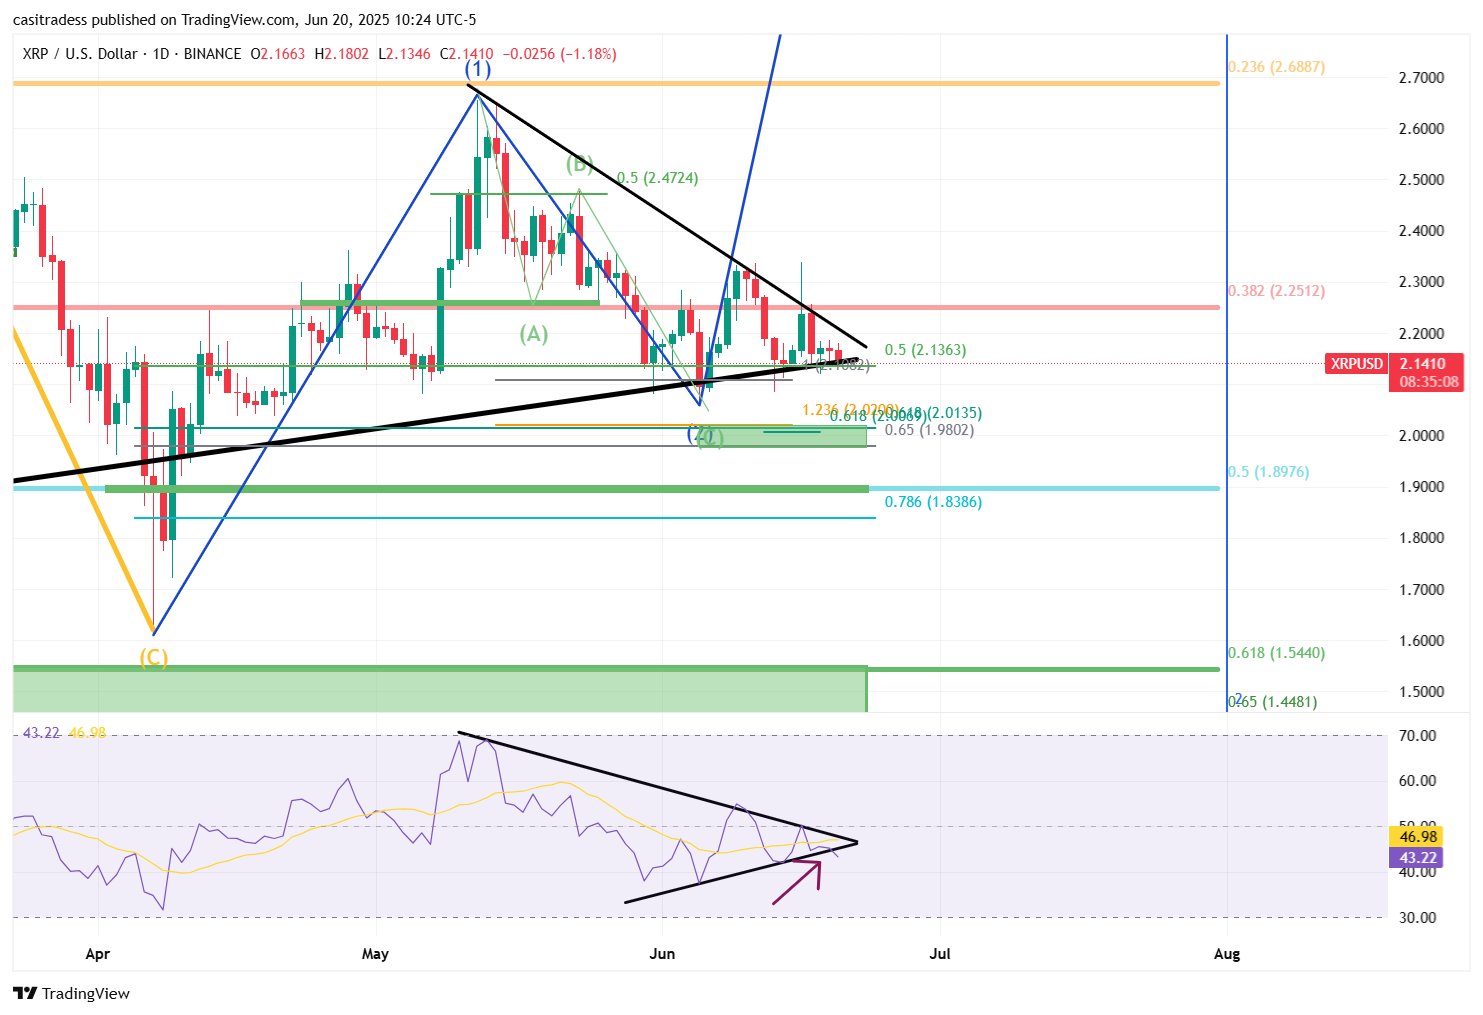
CasiTrades predicts the impending release is likely to initially target lower price regions before initiating a price upswing. The trading expert views this potential breakdown not as bearish price capitulation but rather a final flush needed to gather enough liquidity for a bullish reversal. In this regard, CasiTrades has highlighted potential support zones to be around $2.01, $1.90 and $1.55, all which the analyst states remain valid until XRP achieves a decisive price close above $3.
However, the projected bullish reversal may occur via two routes. Firstly, CasiTrades states that XRP could dip cleanly to any of the highlighted supported zones before executing a V-shaped marker recovery that would indicate the altcoin has found a market bottom. Alternatively, XRP may also get close to the support zones and stall or even produce an early price bounce. In this case, the analyst predicts the token may witness a final exhaustion downward wave before the expected bullish reversal.
XRP Price Overview
At press time, XRP trades at $2.13 reflecting a 1.29% price loss in the past day. Meanwhile, the cryptocurrency also retains negative performances on larger time frames with a loss of 10.39% on the monthly chart respectively. In making any price gains, the market bulls must overcome the key resistance level at $2.37, a successful breakout beyond which would pave the way for a rally toward the $2.60 mark.
Featured image from Pexels, chart from Tradingview
Editorial Process for bitcoinist is centered on delivering thoroughly researched, accurate, and unbiased content. We uphold strict sourcing standards, and each page undergoes diligent review by our team of top technology experts and seasoned editors. This process ensures the integrity, relevance, and value of our content for our readers.


Related Posts


Stay Informed With the Latest & Most Important News
Previous Post
Next Post
:max_bytes(150000):strip_icc()/GettyImages-2218163409-6677086129dd4188be2cf83b0f087c7b.jpg?w=1920&resize=1920,1267&ssl=1 "Here’s What Reviewers Are Saying About Nintendo’s New Switch 2 Console")


Advertisement


:max_bytes(150000):strip_icc()/GettyImages-2220646012-ff17aa5d0c774933806f095204c77771.jpg?w=150&resize=150,150&ssl=1 "US Completes ‘Very Successful Attack’ on Iran Nuclear Sites, Trump Says")


