Now Reading: What are the most popular Price Action Patterns And Their Percentage Of Success
-
01
What are the most popular Price Action Patterns And Their Percentage Of Success

What are the most popular Price Action Patterns And Their Percentage Of Success


Below is a brief overview of some popular chart patterns often used in technical analysis, along with approximate “success rates” based on historical backtesting (particularly from well-known sources like Thomas Bulkowski’s research). Keep in mind these are not guarantees—success rates vary by market conditions (bull/bear), asset class, time frame, and how strictly you define a “successful” breakout or price target.
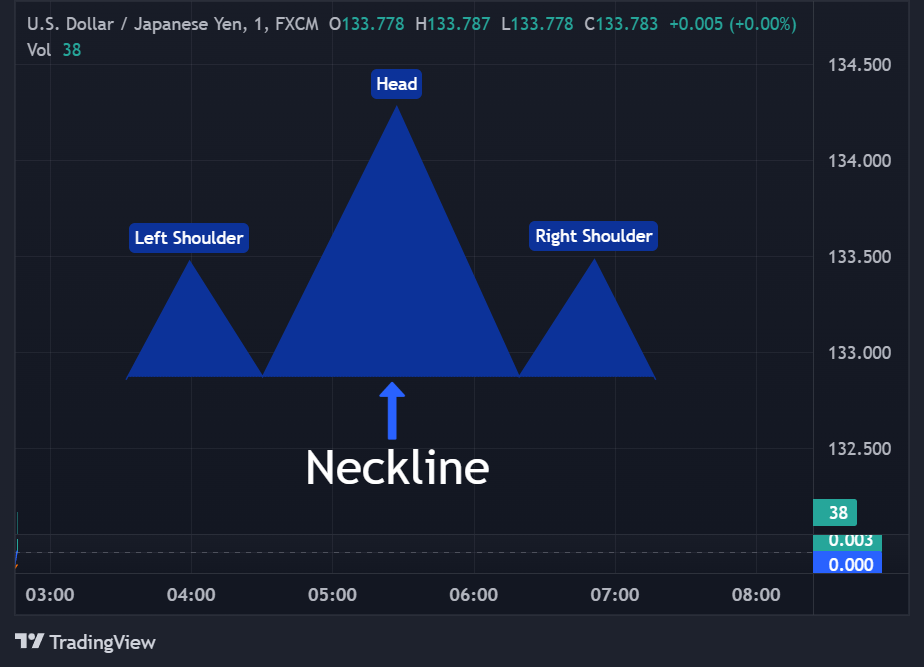
1. Head & Shoulders (Top/Bottom)
- Overview:
- A “Head & Shoulders Top” forms after an uptrend, indicating a potential bearish reversal.
- A “Head & Shoulders Bottom” (Inverse Head & Shoulders) forms after a downtrend, indicating a potential bullish reversal.
- Approx. Success Rate:
- Head & Shoulders Top: 80–85%
- Inverse Head & Shoulders: 80–85%
These patterns are known for relatively high reliability when they confirm a breakout past the “neckline.”
2. Double Top / Double Bottom
- Overview:
- Double Top: Price tests a resistance level twice, suggesting a potential bearish reversal.
- Double Bottom: Price tests a support level twice, suggesting a potential bullish reversal.
- Approx. Success Rate:
- Double Top: 60–70%
- Double Bottom: 65–75%
Success rates often improve if the second “top” or “bottom” slightly undercuts/overshoots the first, confirming strong resistance or support.
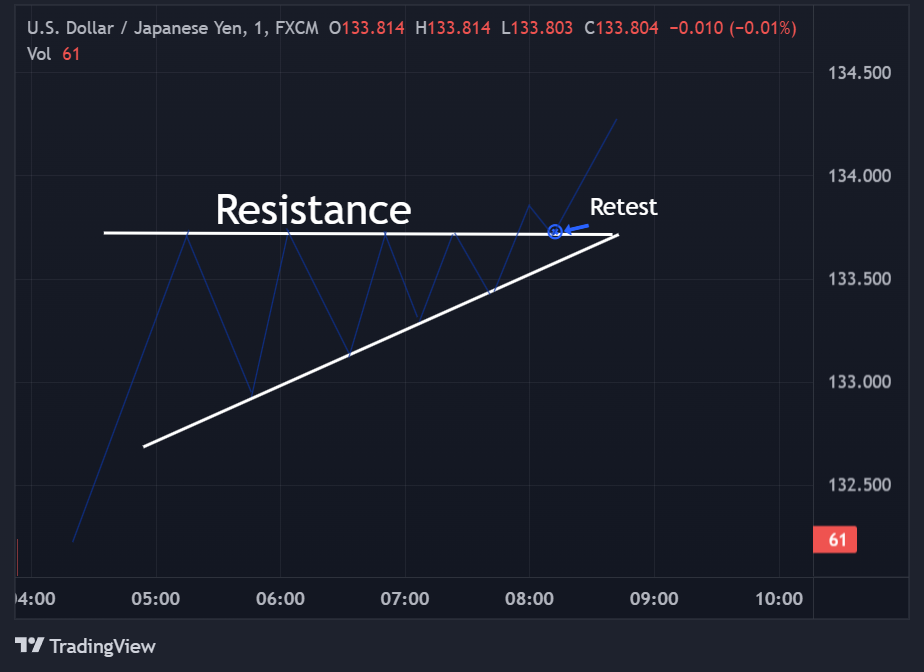
3. Triangles (Ascending, Descending, Symmetrical)
Ascending Triangle
- Overview: Typically a bullish continuation pattern: the top line is flat (resistance), and the bottom line slopes upward (higher lows).
- Approx. Success Rate: 65–75%
- Notes: Often breaks out upward, but if it fails, that can be a strong bearish signal.
Descending Triangle
- Overview: Often a bearish continuation pattern: the bottom line is flat (support), and the top line slopes downward (lower highs).
- Approx. Success Rate: 60–70%
- Notes: In strongly bullish markets, the pattern may actually break upward more than you’d expect, so context matters.

Symmetrical Triangle
- Overview: Converging trendlines of lower highs and higher lows, can break either way. Often seen as a continuation pattern of the prevailing trend.
- Approx. Success Rate: 55–65%
- Notes: Because they’re more neutral, success rates vary widely with market sentiment. The direction of the breakout is key.
4. Cup & Handle
- Overview: A bullish continuation pattern where price forms a rounded “cup,” then a slight pullback (the “handle”) before breaking out.
- Approx. Success Rate: 65–75%
- Notes: Typically seen in stocks and crypto after a strong uptrend. The handle should ideally be shallower than the cup.
5. Wedges (Rising/Falling)
Rising Wedge (Bearish)
- Overview: Price makes higher highs and higher lows, but the slopes converge. Typically signals a bearish reversal when price breaks down.
- Approx. Success Rate: 60–70%
Falling Wedge (Bullish)
- Overview: Price makes lower lows and lower highs, converging. Typically signals a bullish reversal when price breaks up.
- Approx. Success Rate: 65–75%
6. Flags & Pennants
- Overview: Short-term continuation patterns that form after a sharp price move (the “flagpole”). The price consolidates in a small rectangular (flag) or triangular (pennant) shape.
- Approx. Success Rate: 60–70%
These patterns often appear in strong, trending markets—crypto in particular. Volume spikes during the initial move and tapers off during consolidation.
Important Disclaimers
- Market Conditions Matter: A descending triangle in a strong bull market might break upward more often than historical averages suggest, and vice versa.
- Success Rate Definitions Vary: Some studies count success as “price hitting the measured target,” while others might require just a breakout in the expected direction.
- Risk Management Is Crucial: Even if a pattern has a high historical success rate, no pattern is 100%. Use stop-losses or other risk controls.
- Combine with Other Analysis: Consider volume trends, support/resistance levels, and overall market sentiment. Patterns alone shouldn’t be your only tool.
In Summary
Chart patterns like triangles, head & shoulders, and double tops/bottoms can offer useful clues about potential price direction. Historical success rates (60–80%) suggest that many patterns can be profitable if traded properly. However, always incorporate solid risk management and remember that no chart pattern is guaranteed in every scenario.


Stay Informed With the Latest & Most Important News
Previous Post
Next Post


Advertisement


:max_bytes(150000):strip_icc()/GettyImages-2215283536-0e96b4991b004c4980c2499a36ac4def.jpg?w=150&resize=150,150&ssl=1 "Walmart to Cut Jobs as It Focuses on ‘Future of Retail’")
