Now Reading: Bitcoin Is Flowing Into US Platforms: Why This Is Bullish
-
01
Bitcoin Is Flowing Into US Platforms: Why This Is Bullish


On-chain data shows the US-based central entities have been increasing their Bitcoin share recently. Here’s what this could mean for the asset.
Bitcoin US To The Rest Reserve Ratio Has Formed A Golden Cross
In a CryptoQuant Quicktake post, an analyst has talked about the latest trend in the Bitcoin US to The Rest Reserve Ratio. This indicator tells us, as its name already suggests, the ratio between the amount of the asset held by the American centralized platforms and that by the off-shore ones.
The metric takes into account for not just cryptocurrency exchange reserves, but also the coins involved with the likes of exchange-traded funds (ETFs). When its value rises, it means coins are transferring from other platforms into the US-based ones. On the other hand, it going down suggests foreign platforms are gaining dominance.
Now, here is the chart for the Bitcoin US to The Rest Reserve Ratio shared by the quant that shows the trend in its 20-day and 50-day exponential moving averages (EMAs) over the past year and a half:

Looks like the two lines have gone through a crossover in recent weeks | Source: CryptoQuant
As displayed in the above graph, the 20-day EMA of the Bitcoin US to The Rest Reserve Ratio has seen a sharp surge during the past month, which implies the American entities have been gaining more share. Earlier, these platforms had been losing dominance so fast that the 20-day EMA fell below the 50-day one, but now, the reverse crossover has occurred with this uptrend.
From the chart, it’s visible that this type of crossover occurred last year as well. Clearly, this previous instance led to a rally for Bitcoin that took its price to new highs. The latest one has so far also had the same effect on the cryptocurrency, as it’s entered into all-time high exploration mode. Also, if the last golden crossover is to go by, this fresh run may go on for a while as well.
Something to keep an eye out for, however, is the death cross, which takes place when US platforms start losing dominance at a rate that takes the 20-day EMA under the 50-day one. Both of the previous occurrences of this pattern meant the end of bullish momentum for Bitcoin. As the analyst says, “ride the bullish wave while it lasts—until a death cross signals the end.”
In some other news, dormant coins have been moving back into circulation recently, as the on-chain analytics firm Santiment has pointed out in an X post.
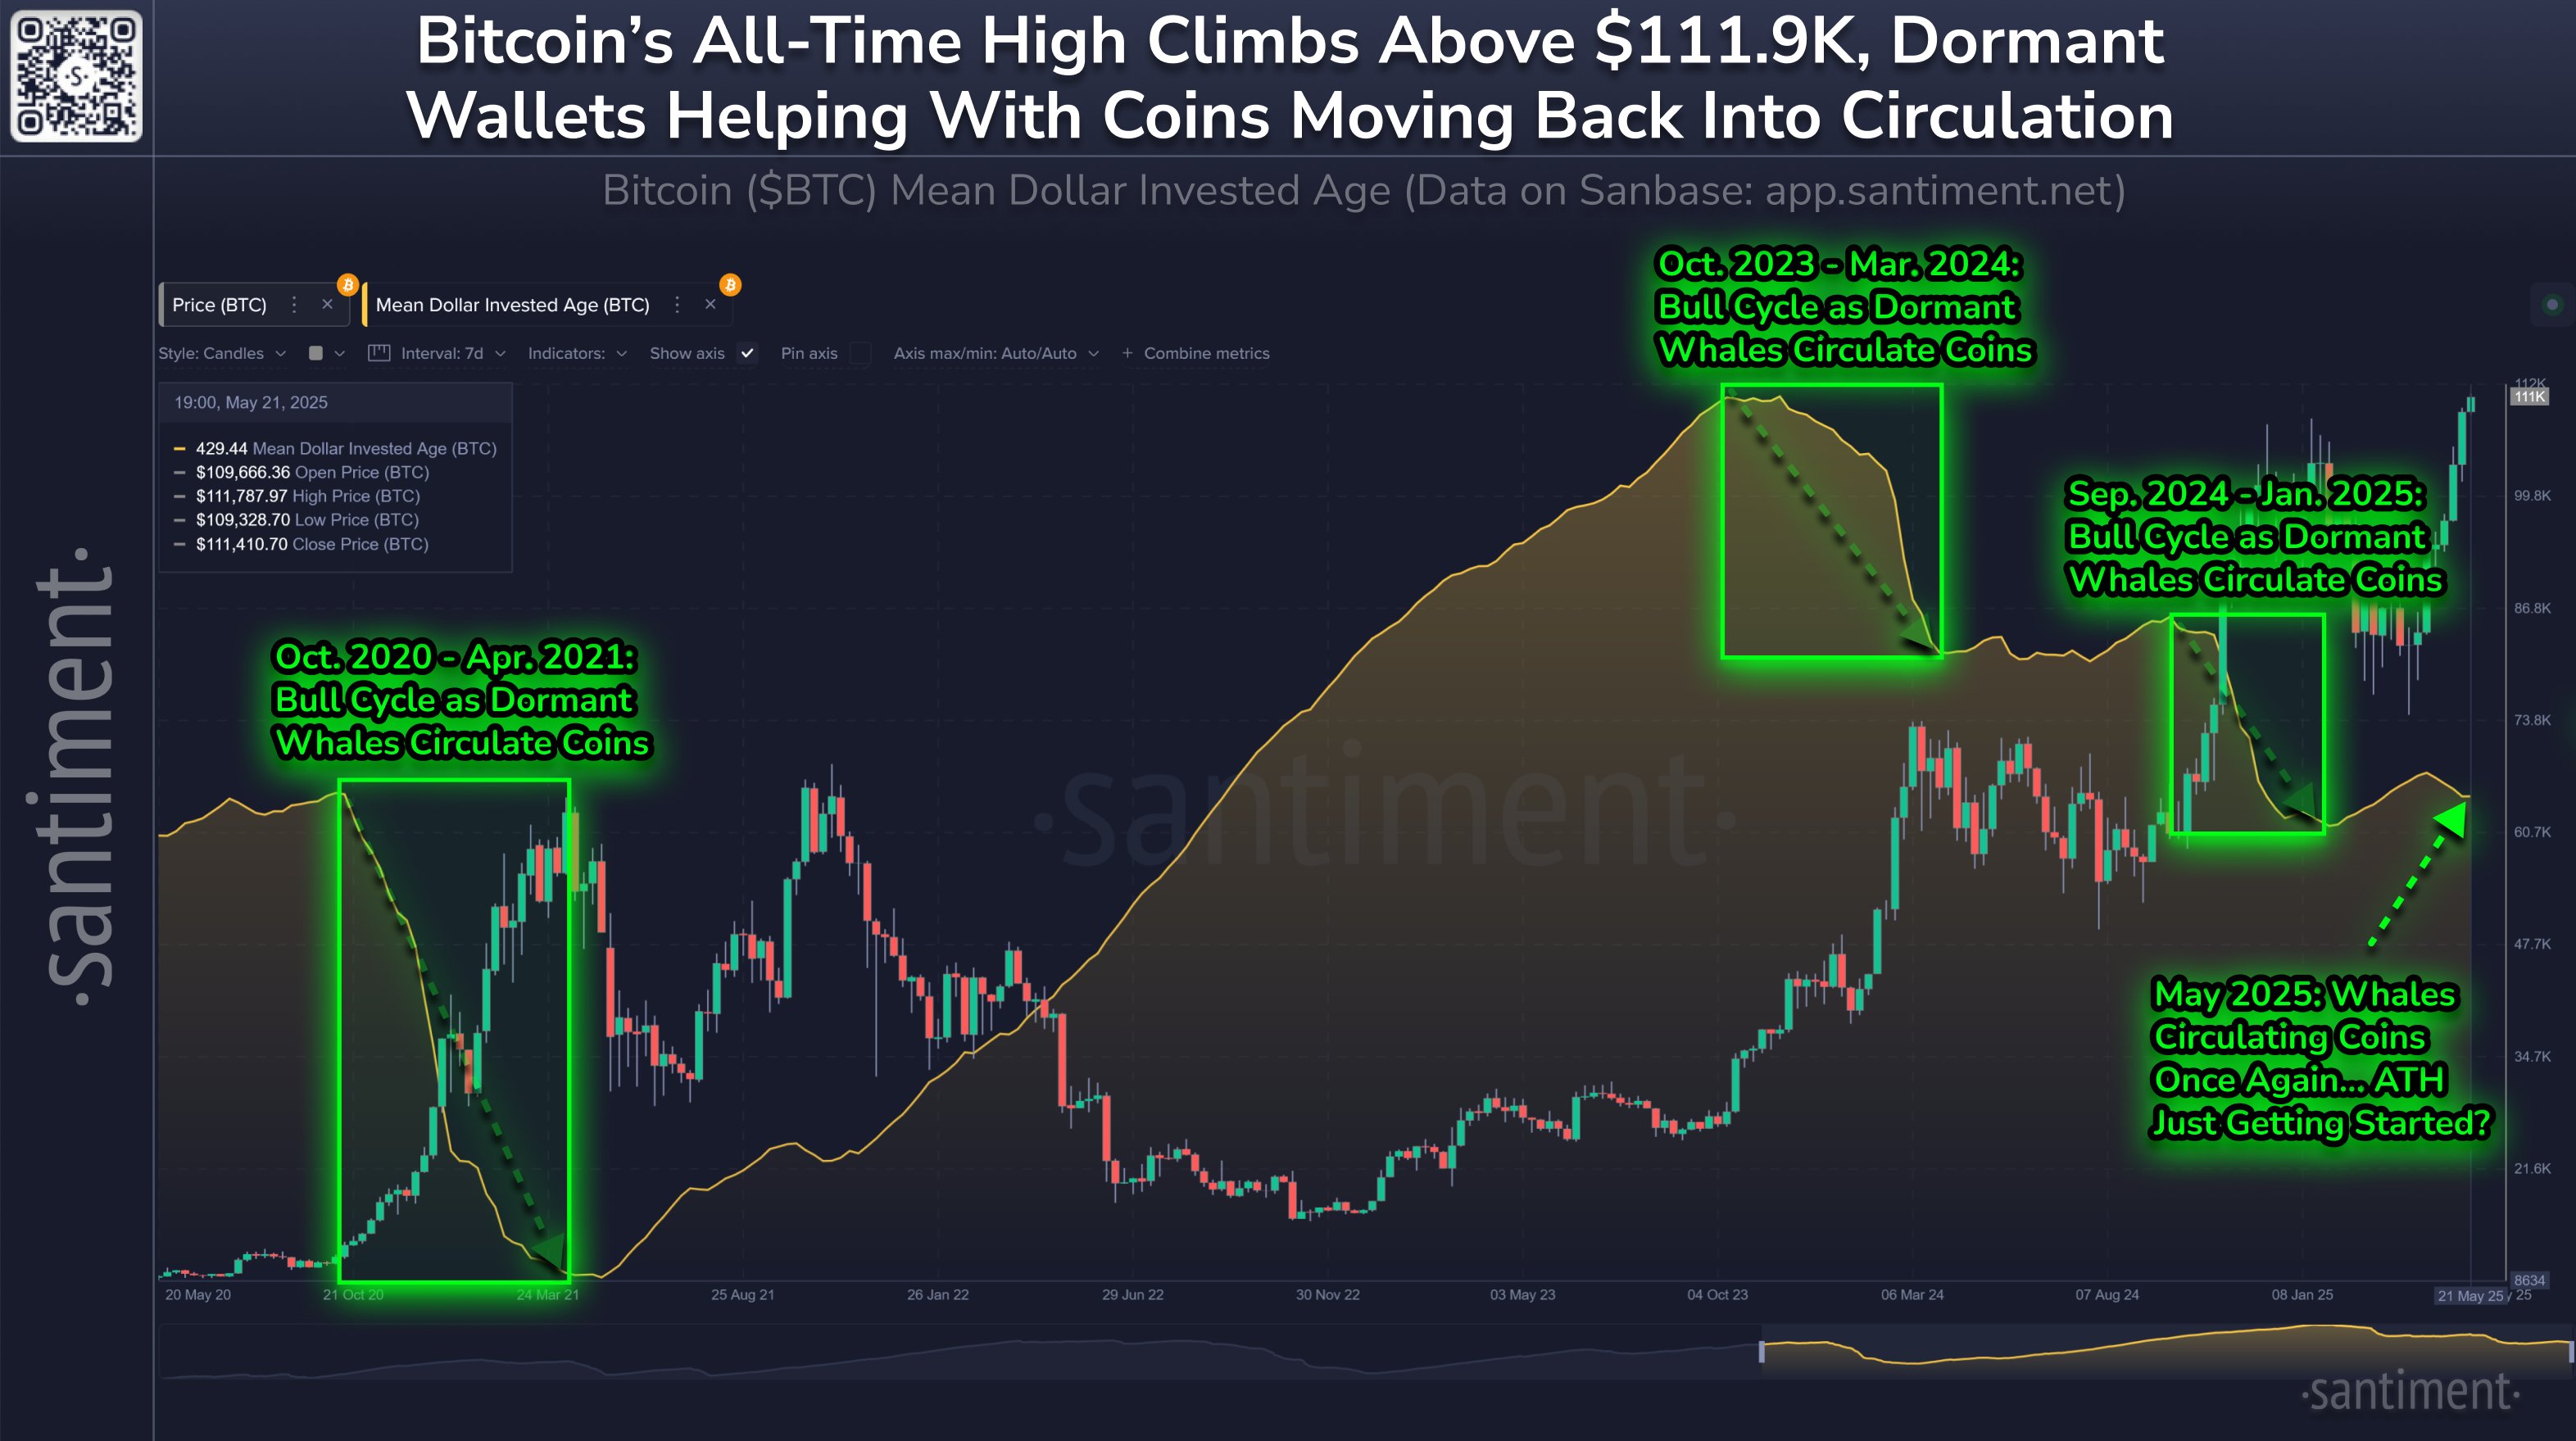
The trend in the Mean Dollar Invested Age of BTC | Source: Santiment on X
As is apparent from the chart, the resolute hands only move their aged coins during major bull run opportunities. These smart hands have recently been showing this trend for the third time this cycle. It now remains to be seen whether this rally will be as big as those other two instances.
BTC Price
Bitcoin has faced a small pullback as its price has come back down to the $109,300 mark.
The price of the coin seems to have been moving up during the past few days | Source: BTCUSDT on TradingView
Featured image from Dall-E, CryptoQuant.com, Santiment.net, chart from TradingView.com
Editorial Process for bitcoinist is centered on delivering thoroughly researched, accurate, and unbiased content. We uphold strict sourcing standards, and each page undergoes diligent review by our team of top technology experts and seasoned editors. This process ensures the integrity, relevance, and value of our content for our readers.


Related Posts


Stay Informed With the Latest & Most Important News
Previous Post
Next Post
Previous Post

Next Post


Advertisement


:max_bytes(150000):strip_icc()/GettyImages-2209410171-4c1231745206419a9939116e9ca1d971.jpg?w=150&resize=150,150&ssl=1 "Wages Are A Big Hurdle To Restoring U.S. Manufacturing. But It’s Not What You Think")