Now Reading: What are the most popular Price Action Patterns And Their Percentage Of Success
-
01
What are the most popular Price Action Patterns And Their Percentage Of Success
What are the most popular Price Action Patterns And Their Percentage Of Success

Below is a brief overview of some popular chart patterns often used in technical analysis, along with approximate “success rates” based on historical backtesting (particularly from well-known sources like Thomas Bulkowski’s research). Keep in mind these are not guarantees—success rates vary by market conditions (bull/bear), asset class, time frame, and how strictly you define a “successful” breakout or price target.
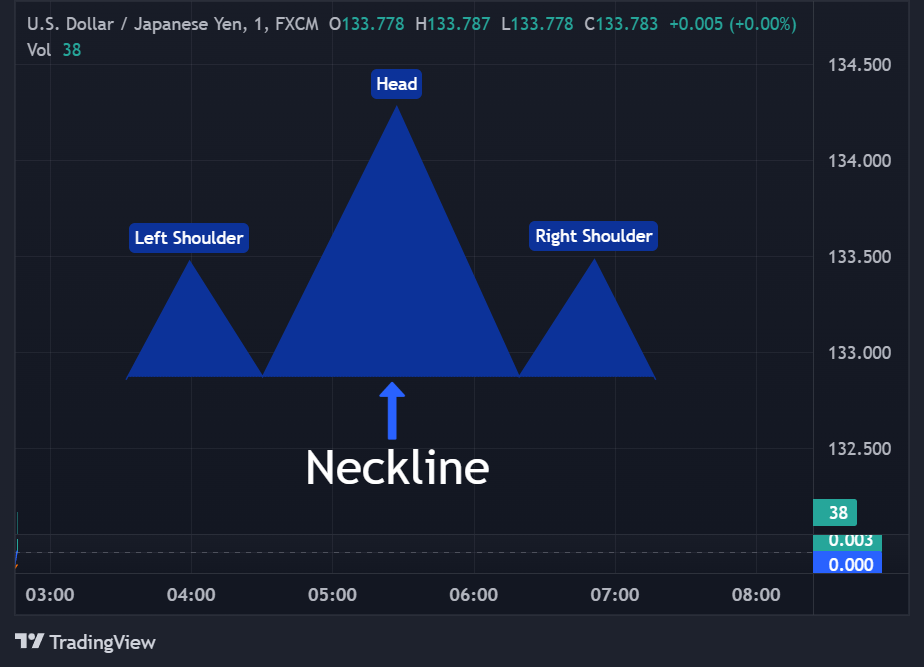
1. Head & Shoulders (Top/Bottom)
- Overview:
- A “Head & Shoulders Top” forms after an uptrend, indicating a potential bearish reversal.
- A “Head & Shoulders Bottom” (Inverse Head & Shoulders) forms after a downtrend, indicating a potential bullish reversal.
- Approx. Success Rate:
- Head & Shoulders Top: 80–85%
- Inverse Head & Shoulders: 80–85%
These patterns are known for relatively high reliability when they confirm a breakout past the “neckline.”

2. Double Top / Double Bottom
- Overview:
- Double Top: Price tests a resistance level twice, suggesting a potential bearish reversal.
- Double Bottom: Price tests a support level twice, suggesting a potential bullish reversal.
- Approx. Success Rate:
- Double Top: 60–70%
- Double Bottom: 65–75%
Success rates often improve if the second “top” or “bottom” slightly undercuts/overshoots the first, confirming strong resistance or support.
3. Triangles (Ascending, Descending, Symmetrical)
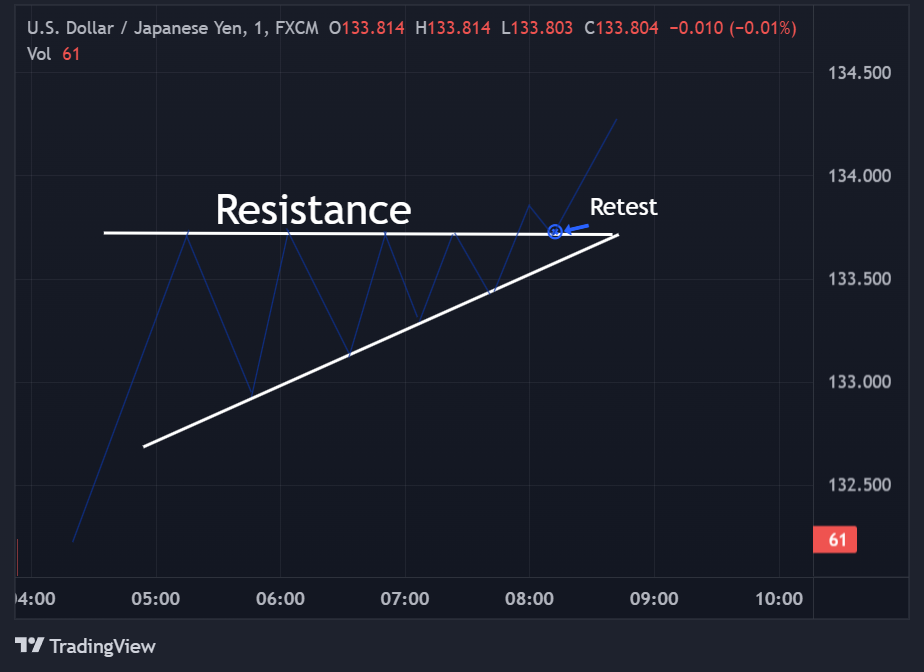
Ascending Triangle
- Overview: Typically a bullish continuation pattern: the top line is flat (resistance), and the bottom line slopes upward (higher lows).
- Approx. Success Rate: 65–75%
- Notes: Often breaks out upward, but if it fails, that can be a strong bearish signal.

Descending Triangle
- Overview: Often a bearish continuation pattern: the bottom line is flat (support), and the top line slopes downward (lower highs).
- Approx. Success Rate: 60–70%
- Notes: In strongly bullish markets, the pattern may actually break upward more than you’d expect, so context matters.

Symmetrical Triangle
- Overview: Converging trendlines of lower highs and higher lows, can break either way. Often seen as a continuation pattern of the prevailing trend.
- Approx. Success Rate: 55–65%
- Notes: Because they’re more neutral, success rates vary widely with market sentiment. The direction of the breakout is key.
4. Cup & Handle
- Overview: A bullish continuation pattern where price forms a rounded “cup,” then a slight pullback (the “handle”) before breaking out.
- Approx. Success Rate: 65–75%
- Notes: Typically seen in stocks and crypto after a strong uptrend. The handle should ideally be shallower than the cup.
5. Wedges (Rising/Falling)
Rising Wedge (Bearish)
- Overview: Price makes higher highs and higher lows, but the slopes converge. Typically signals a bearish reversal when price breaks down.
- Approx. Success Rate: 60–70%
Falling Wedge (Bullish)
- Overview: Price makes lower lows and lower highs, converging. Typically signals a bullish reversal when price breaks up.
- Approx. Success Rate: 65–75%
6. Flags & Pennants
- Overview: Short-term continuation patterns that form after a sharp price move (the “flagpole”). The price consolidates in a small rectangular (flag) or triangular (pennant) shape.
- Approx. Success Rate: 60–70%
These patterns often appear in strong, trending markets—crypto in particular. Volume spikes during the initial move and tapers off during consolidation.
Important Disclaimers
- Market Conditions Matter: A descending triangle in a strong bull market might break upward more often than historical averages suggest, and vice versa.
- Success Rate Definitions Vary: Some studies count success as “price hitting the measured target,” while others might require just a breakout in the expected direction.
- Risk Management Is Crucial: Even if a pattern has a high historical success rate, no pattern is 100%. Use stop-losses or other risk controls.
- Combine with Other Analysis: Consider volume trends, support/resistance levels, and overall market sentiment. Patterns alone shouldn’t be your only tool.
In Summary
Chart patterns like triangles, head & shoulders, and double tops/bottoms can offer useful clues about potential price direction. Historical success rates (60–80%) suggest that many patterns can be profitable if traded properly. However, always incorporate solid risk management and remember that no chart pattern is guaranteed in every scenario.


:max_bytes(150000):strip_icc()/GettyImages-1737798678-34b3ce47535d42ff81a63ac6677b8e39.jpg?w=150&resize=150,150&ssl=1)

